Annotations

Last updated:

|Edit this page

Annotations enable you to add written notes to a particular day or time on all your insights and dashboards so you can see how changes or incidents impact your metrics.

You can use annotations to mark things like feature updates, version releases, and marketing campaigns, which adds helpful context when you're looking into what might have caused a change in your metrics.

Why Annotations are useful

The chart below shows a large spike in website traffic, which has been annotated to explain why that spike occurs. Annotations can be viewed by hovering over them.

PostHog Annotations

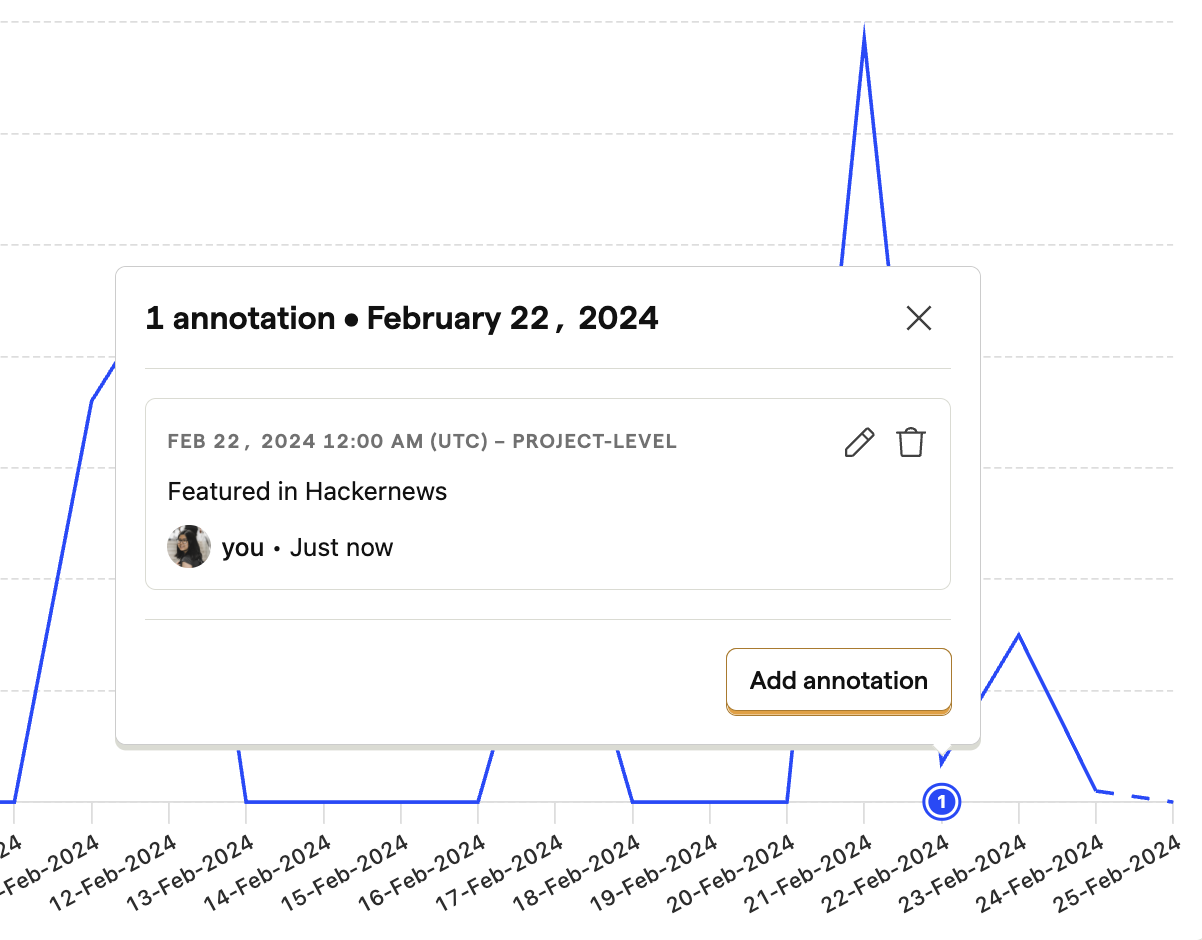
Annotations can be written after the fact, which makes them useful for future reference, or before an event if you want to analyze the future impact of a particular marketing initiative, for example.

Creating an Annotation

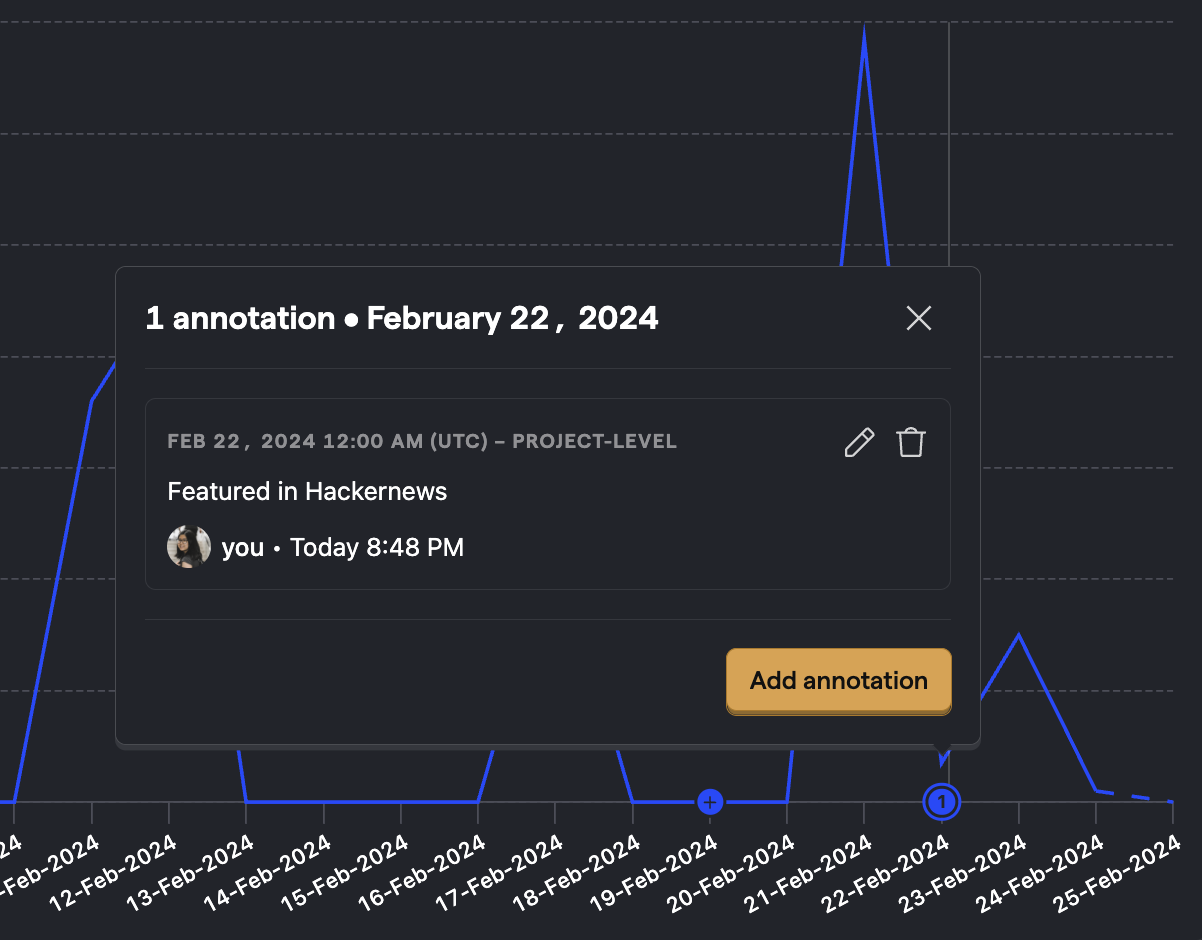
When editing a chart in Trends, Sessions or in a Dashboard, hover your cursor over the dates at the bottom of the chart to reveal a button with a + symbol. Clicking it will then open up a modal where you can create your Annotation, as well as choose to have it specifically for the current chart or all of your charts.

With your annotation created, it will now be available at the bottom of your chart, and you can also view all of your existing annotations in /annotations.

Questions?

  • Matt
    10 months ago

    Is there an API for adding annotations?

    We have a structured store of app release notes. Is there an API we can use to push these into PostHog annotations? Failing that is there e.g. a CSV upload option? Or is manual entry the only option?

  • Abdullah
    2 years ago

    Global annotations?

    Is there a way to create global annotations that appear across all dashboards/graphs?

    • Marcus
      2 years agoSolution

      Hey, that is not possible right now, but we are tracking this feature request in this GitHub issue.

  • Salwa
    2 years ago

    Can I add annotation to a Stickiness visual?

    I have created a Stickiness chart, I want to add annotations to specify where my 'core' user segment starts and ends on the x-axis so team members can read the graph better.

    • Marcus
      2 years agoSolution

      Hey Salwa, the Stickiness chart does not support annotations yet.

Was this page useful?

Next article

Channel type

Channel type is the type of acquisition channel the user came from, for example: Channel Type Description of where the user came from Direct User typed in the URL directly or used a saved link. Paid Search An ad from a search engine, e.g. Google, Bing, or Baidu. Paid Social An ad from a social media platform, e.g. Facebook, LinkedIn, or Twitter Paid Video An ad from a video platform, e.g. YouTube or Twitch. Paid Shopping An ad from a shopping platform, e.g. Amazon or eBay. Paid Unknown An ad…

Read next article

PostHog.com doesn't use third party cookies - only a single in-house cookie.

No data is sent to a third party.

Ursula von der Leyen, President of the European Commission