🚧 Note: Data warehouse integration is currently considered in
beta. We are keen to gather as much feedback as possible so if you try this out please let us know. You can email daniel.b@posthog.com, send feedback via the in-app support panel, or use one of our other support options.
Evaluating experiment metrics always depends on events. They rely on something happening at a certain point in time. If one of your data warehouse tables includes event-like data, you can use it as a primary or secondary metric for your trends experiment.
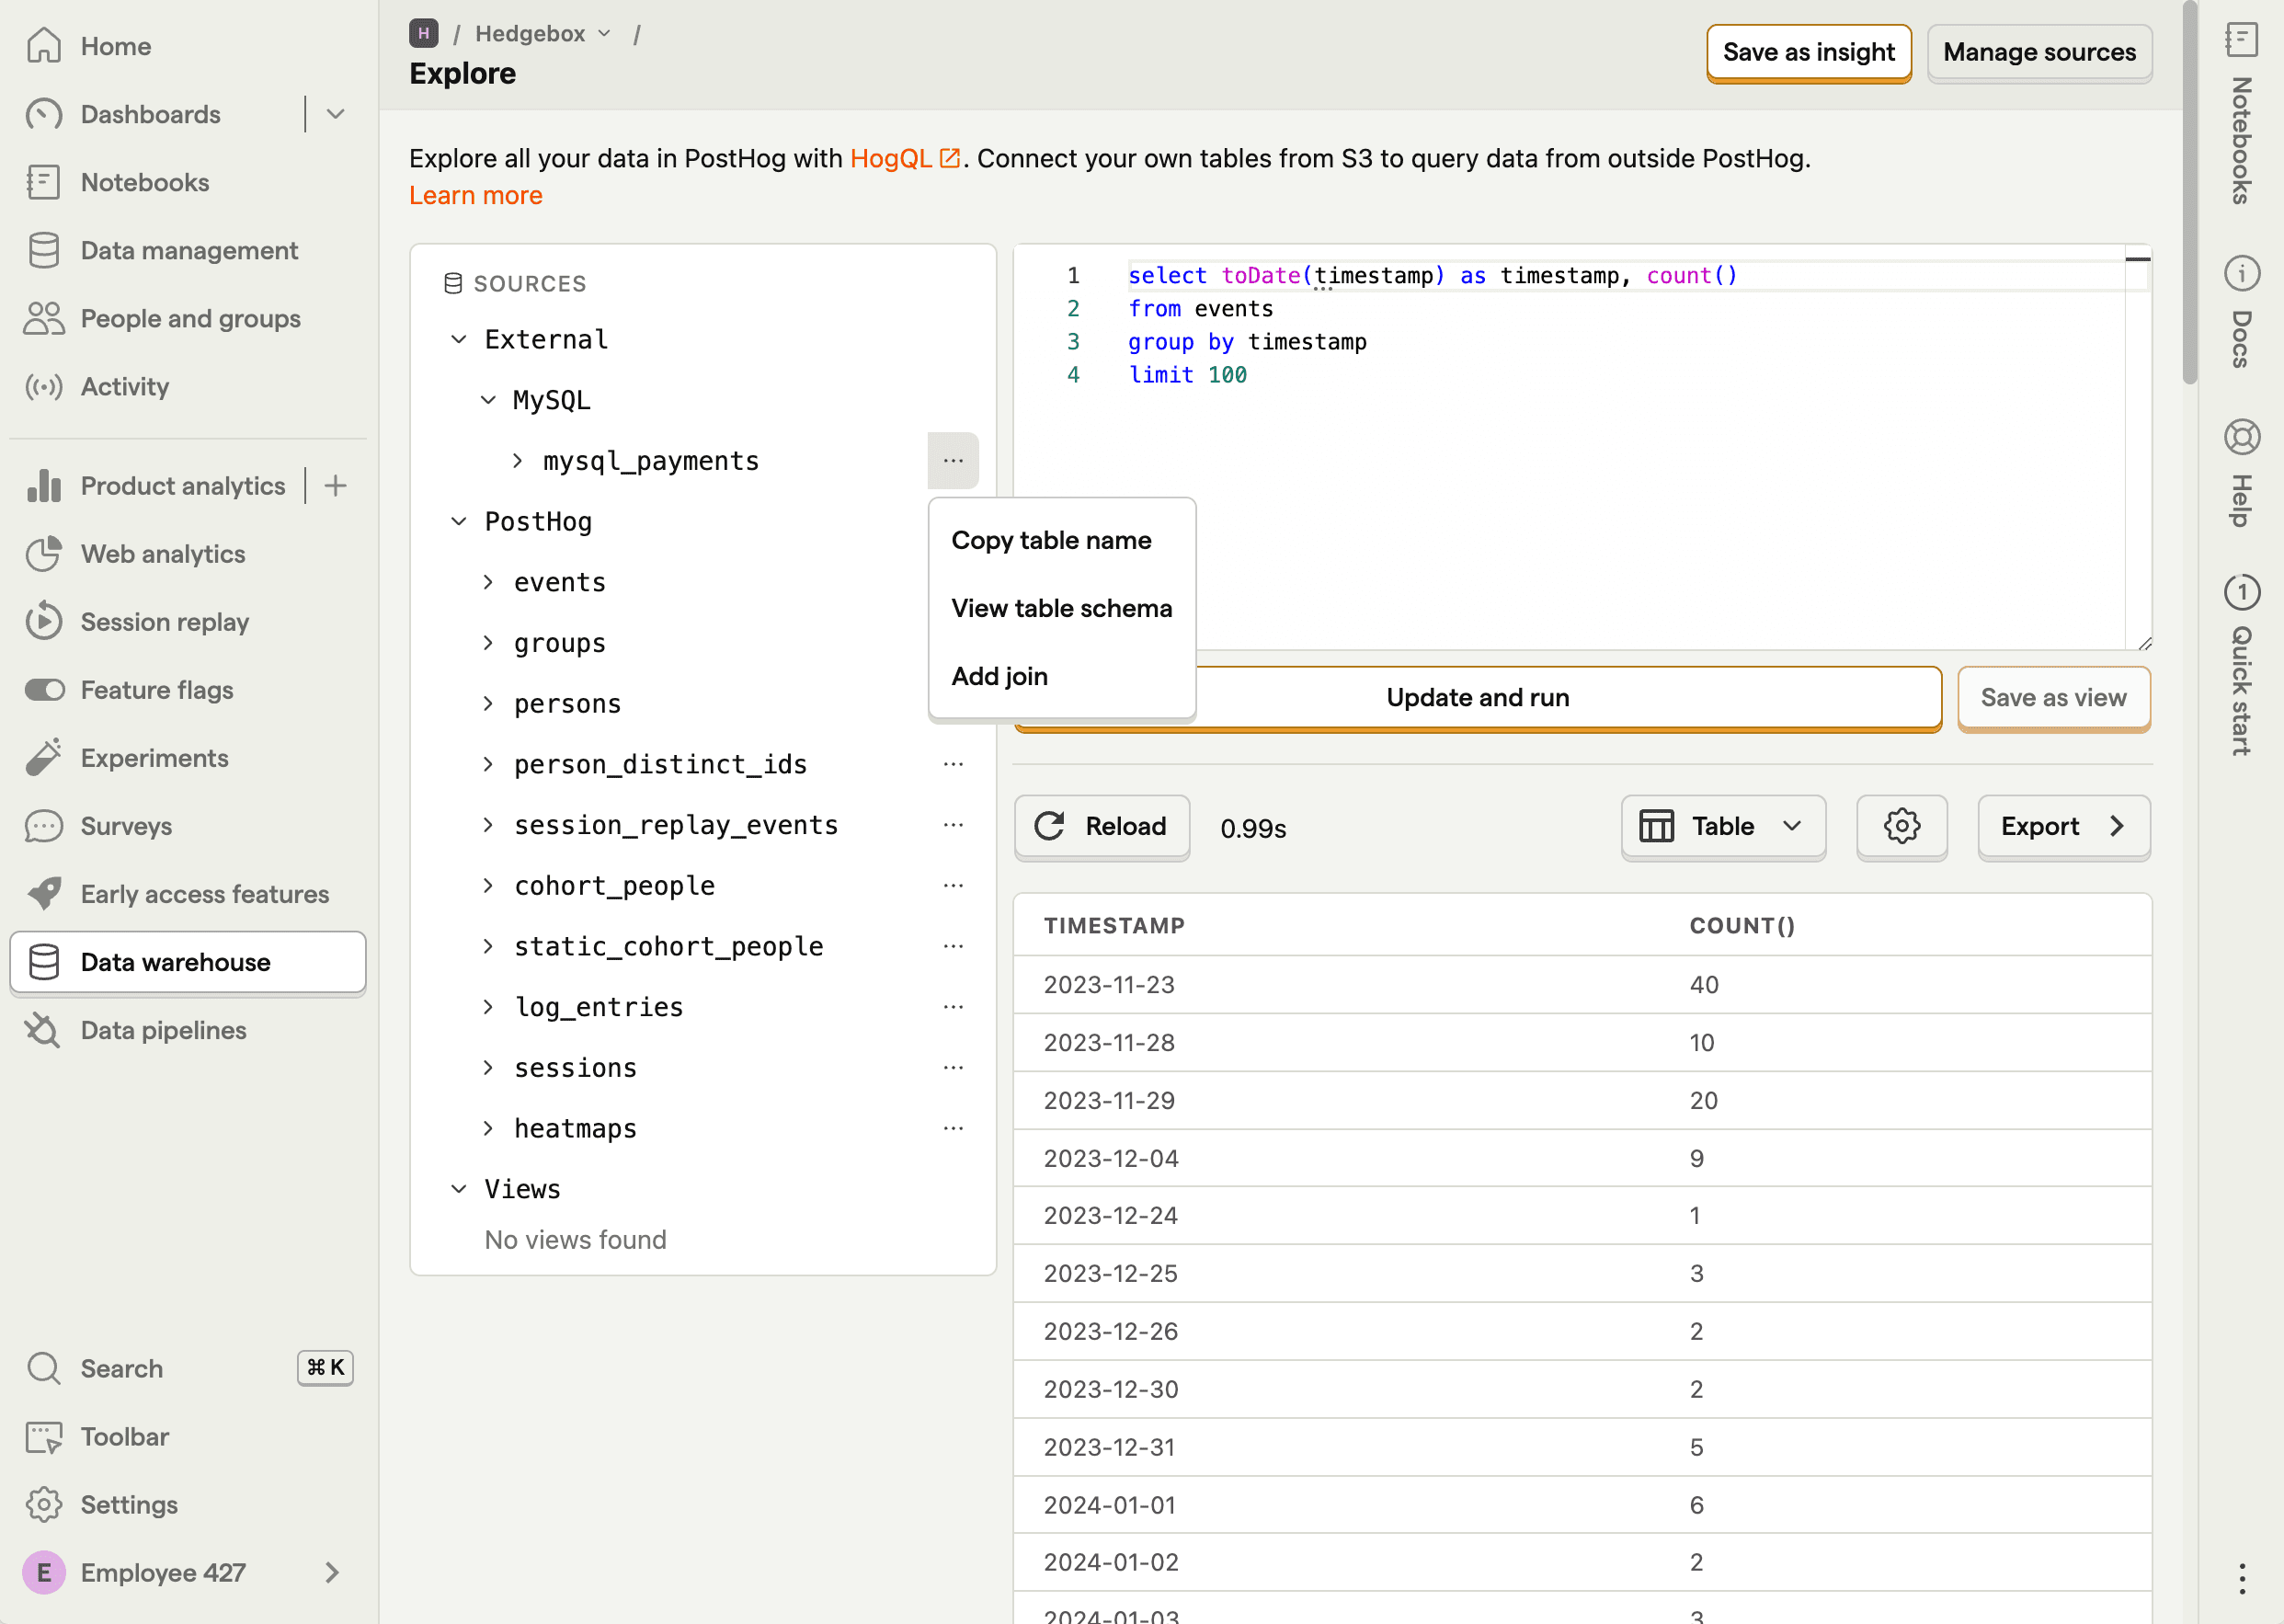
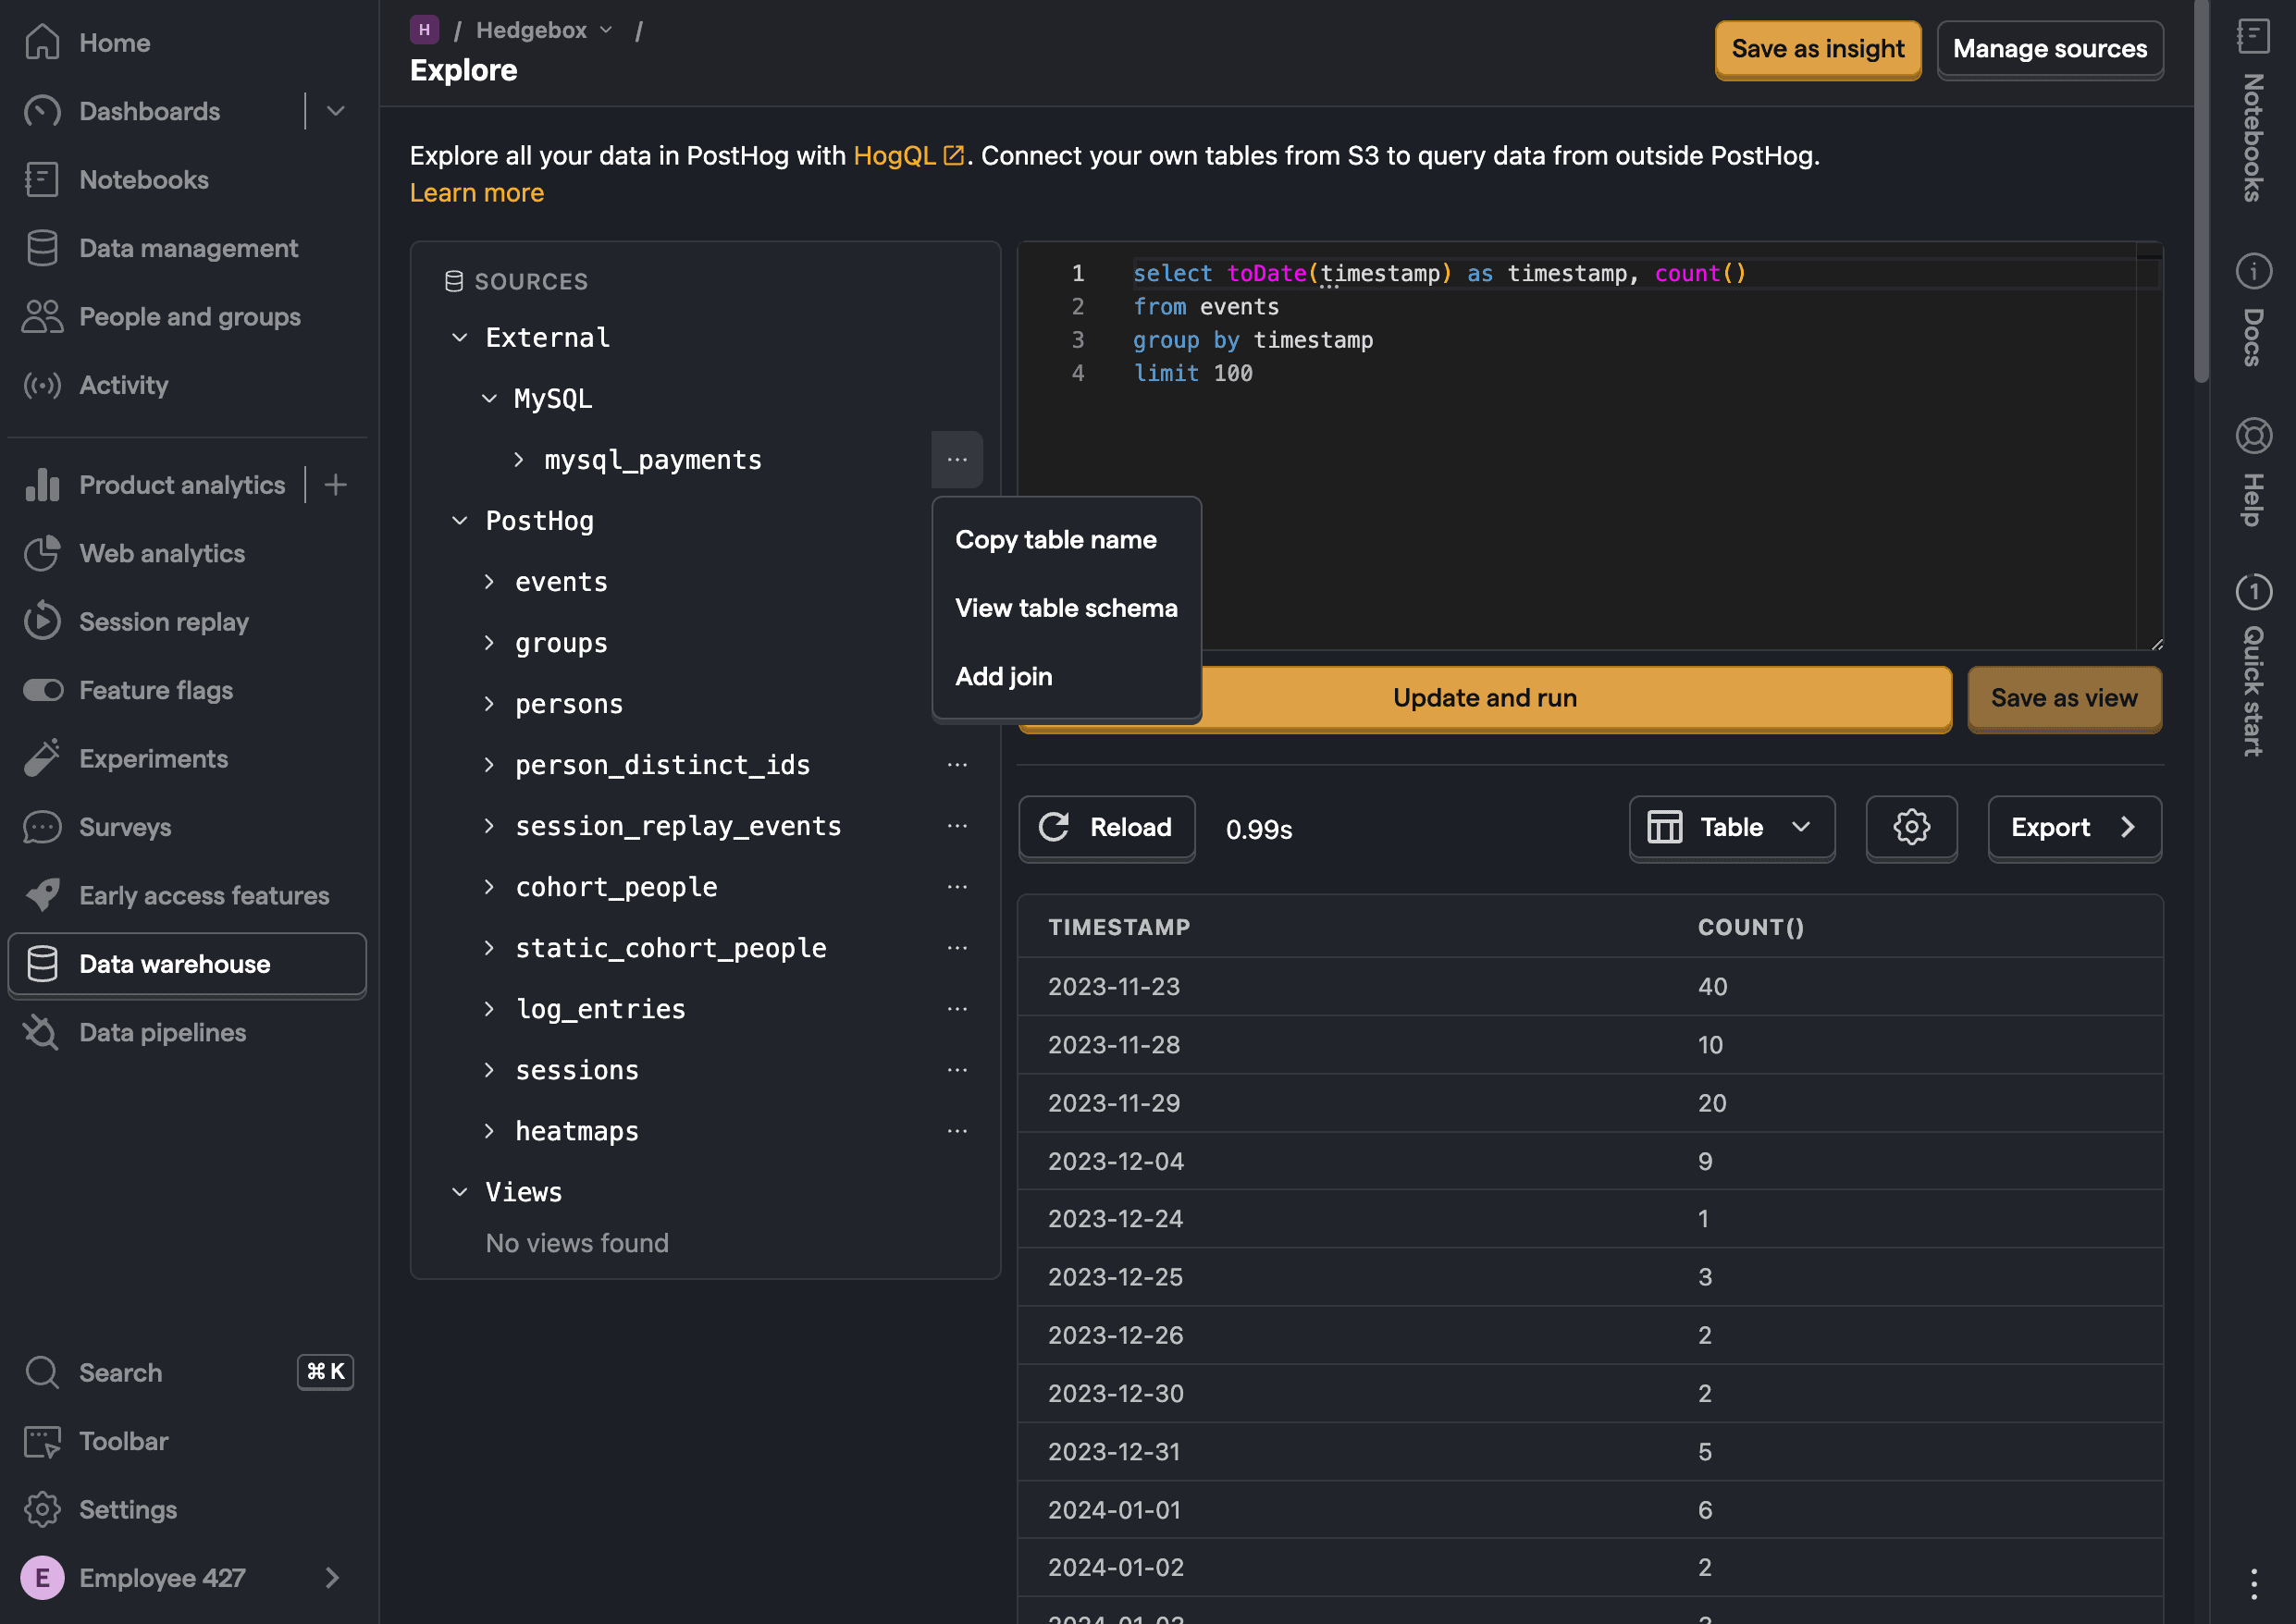
To use a data warehouse table with an experiment, you'll first need to join the 'events' table to your data warehouse table:
- Navigate to the Data warehouse tab and click on Add join from the triple dot menu next to your table.
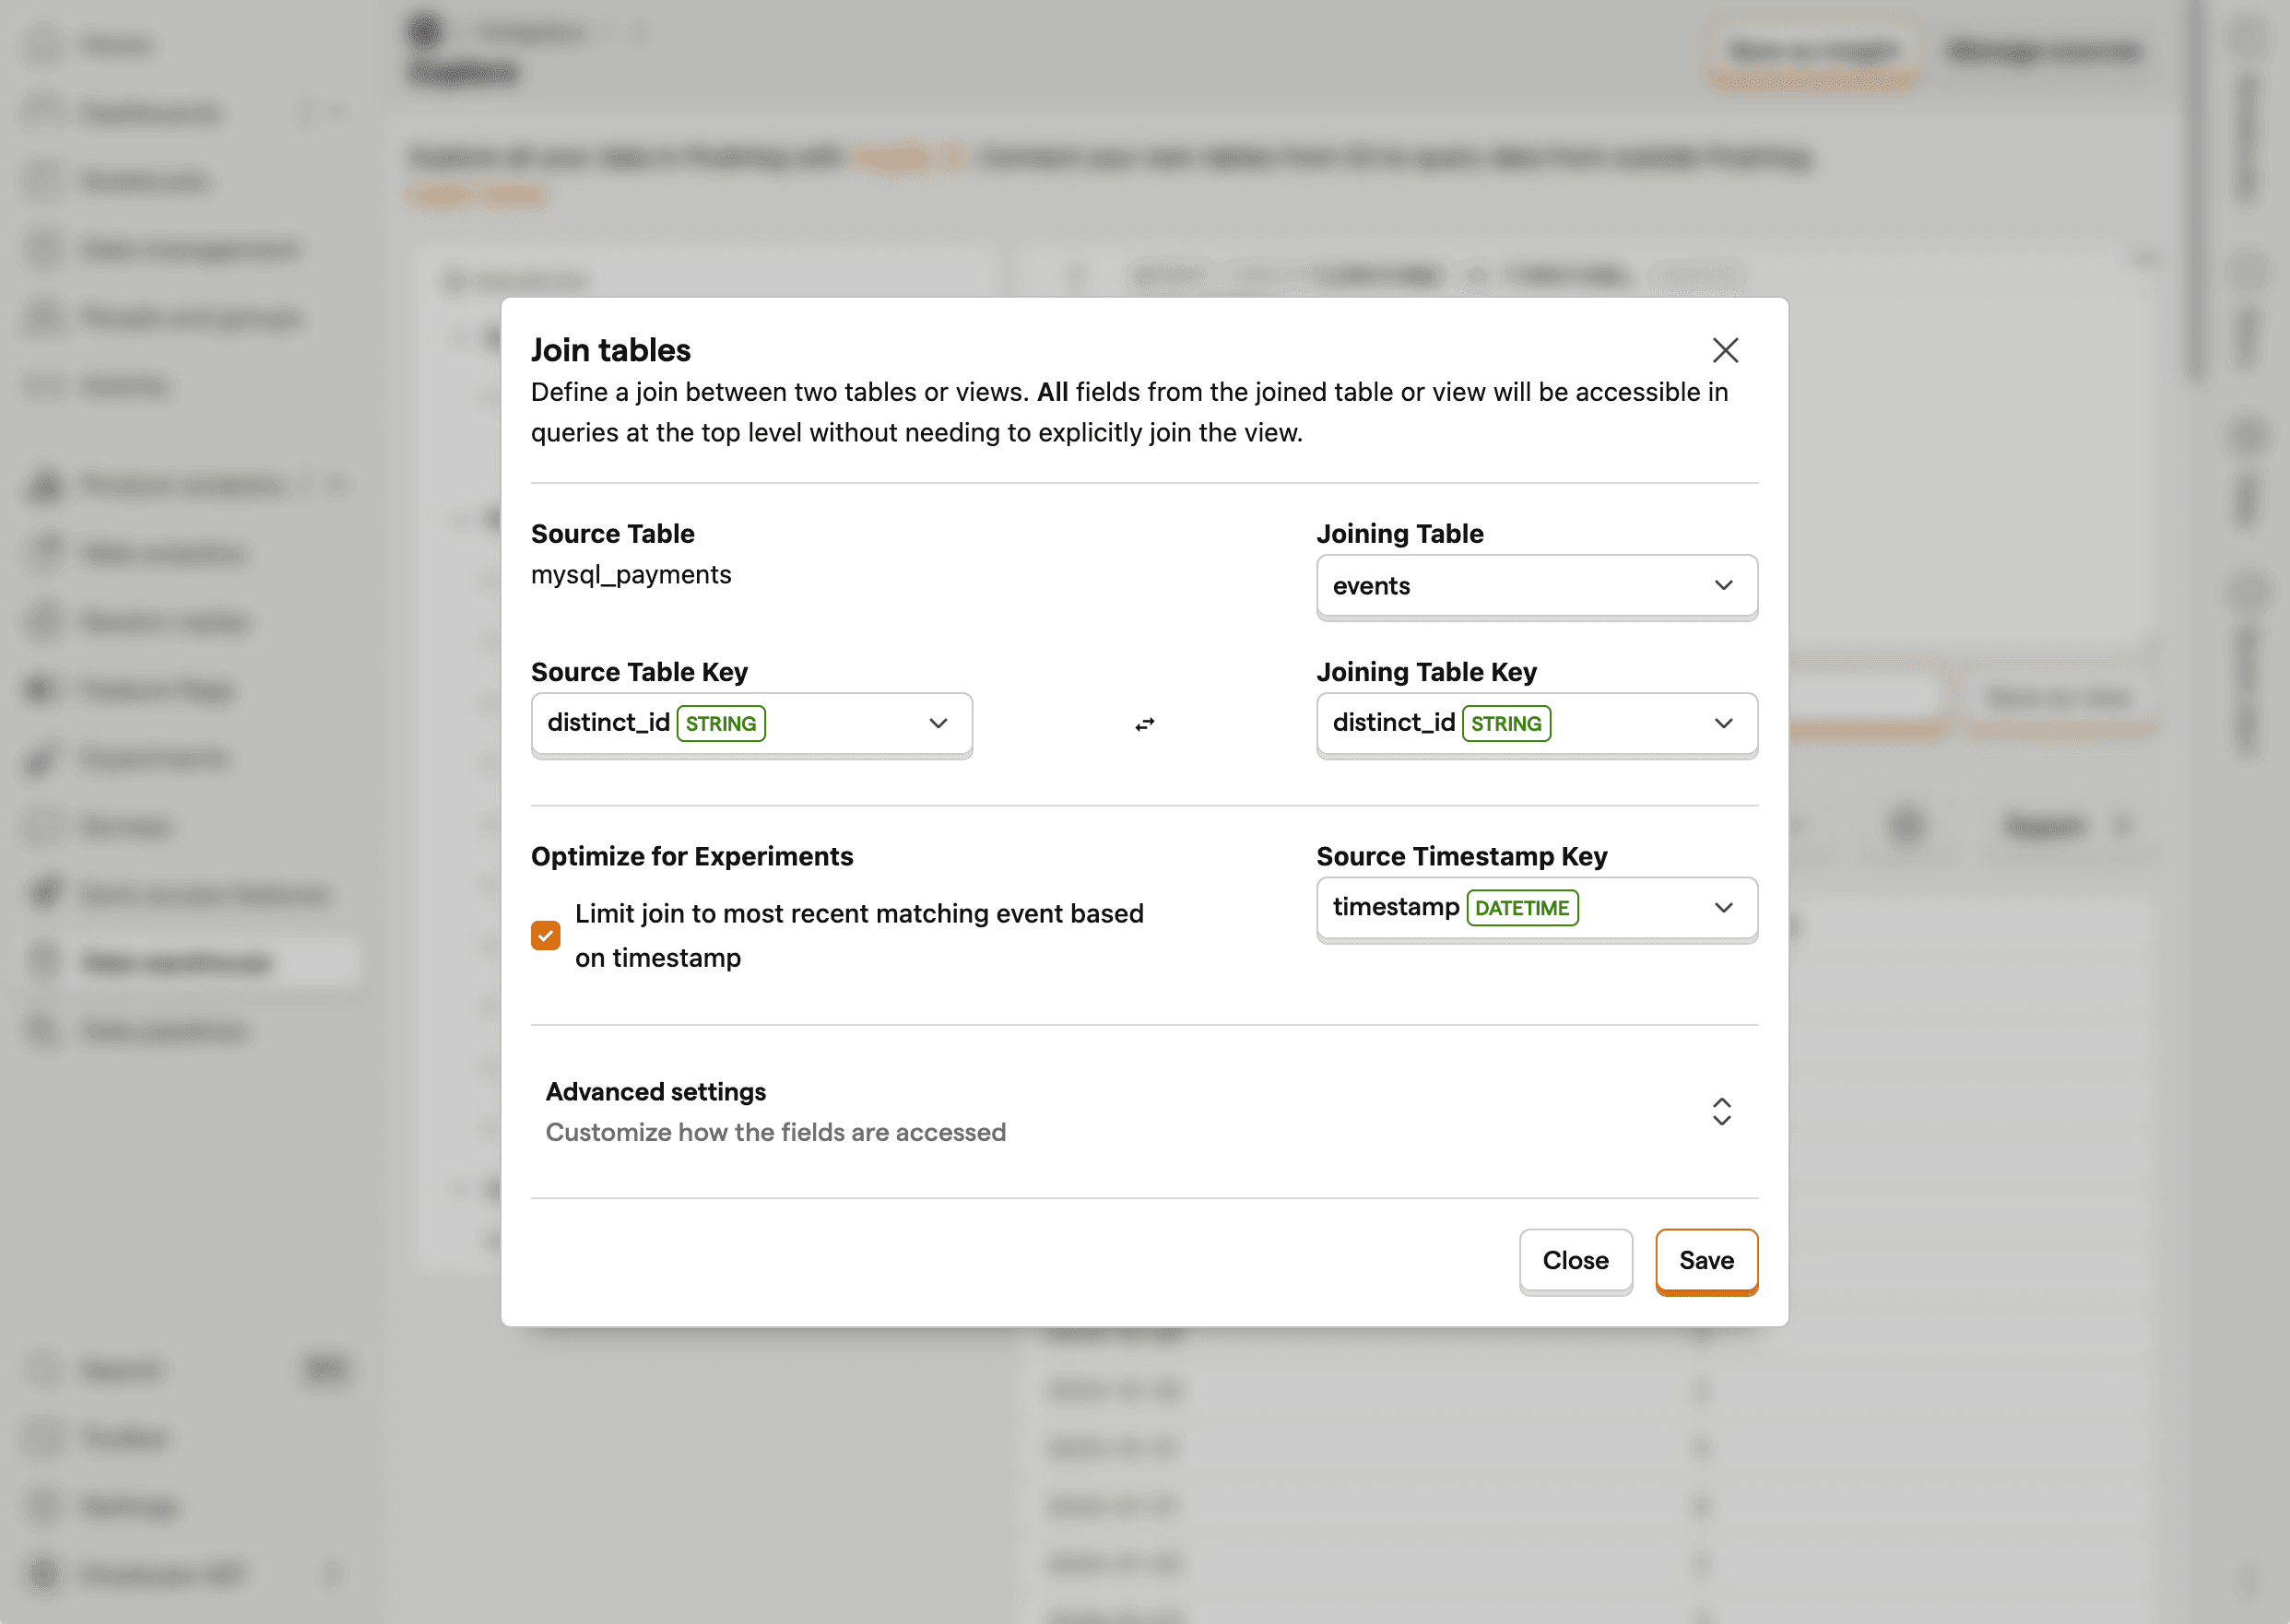
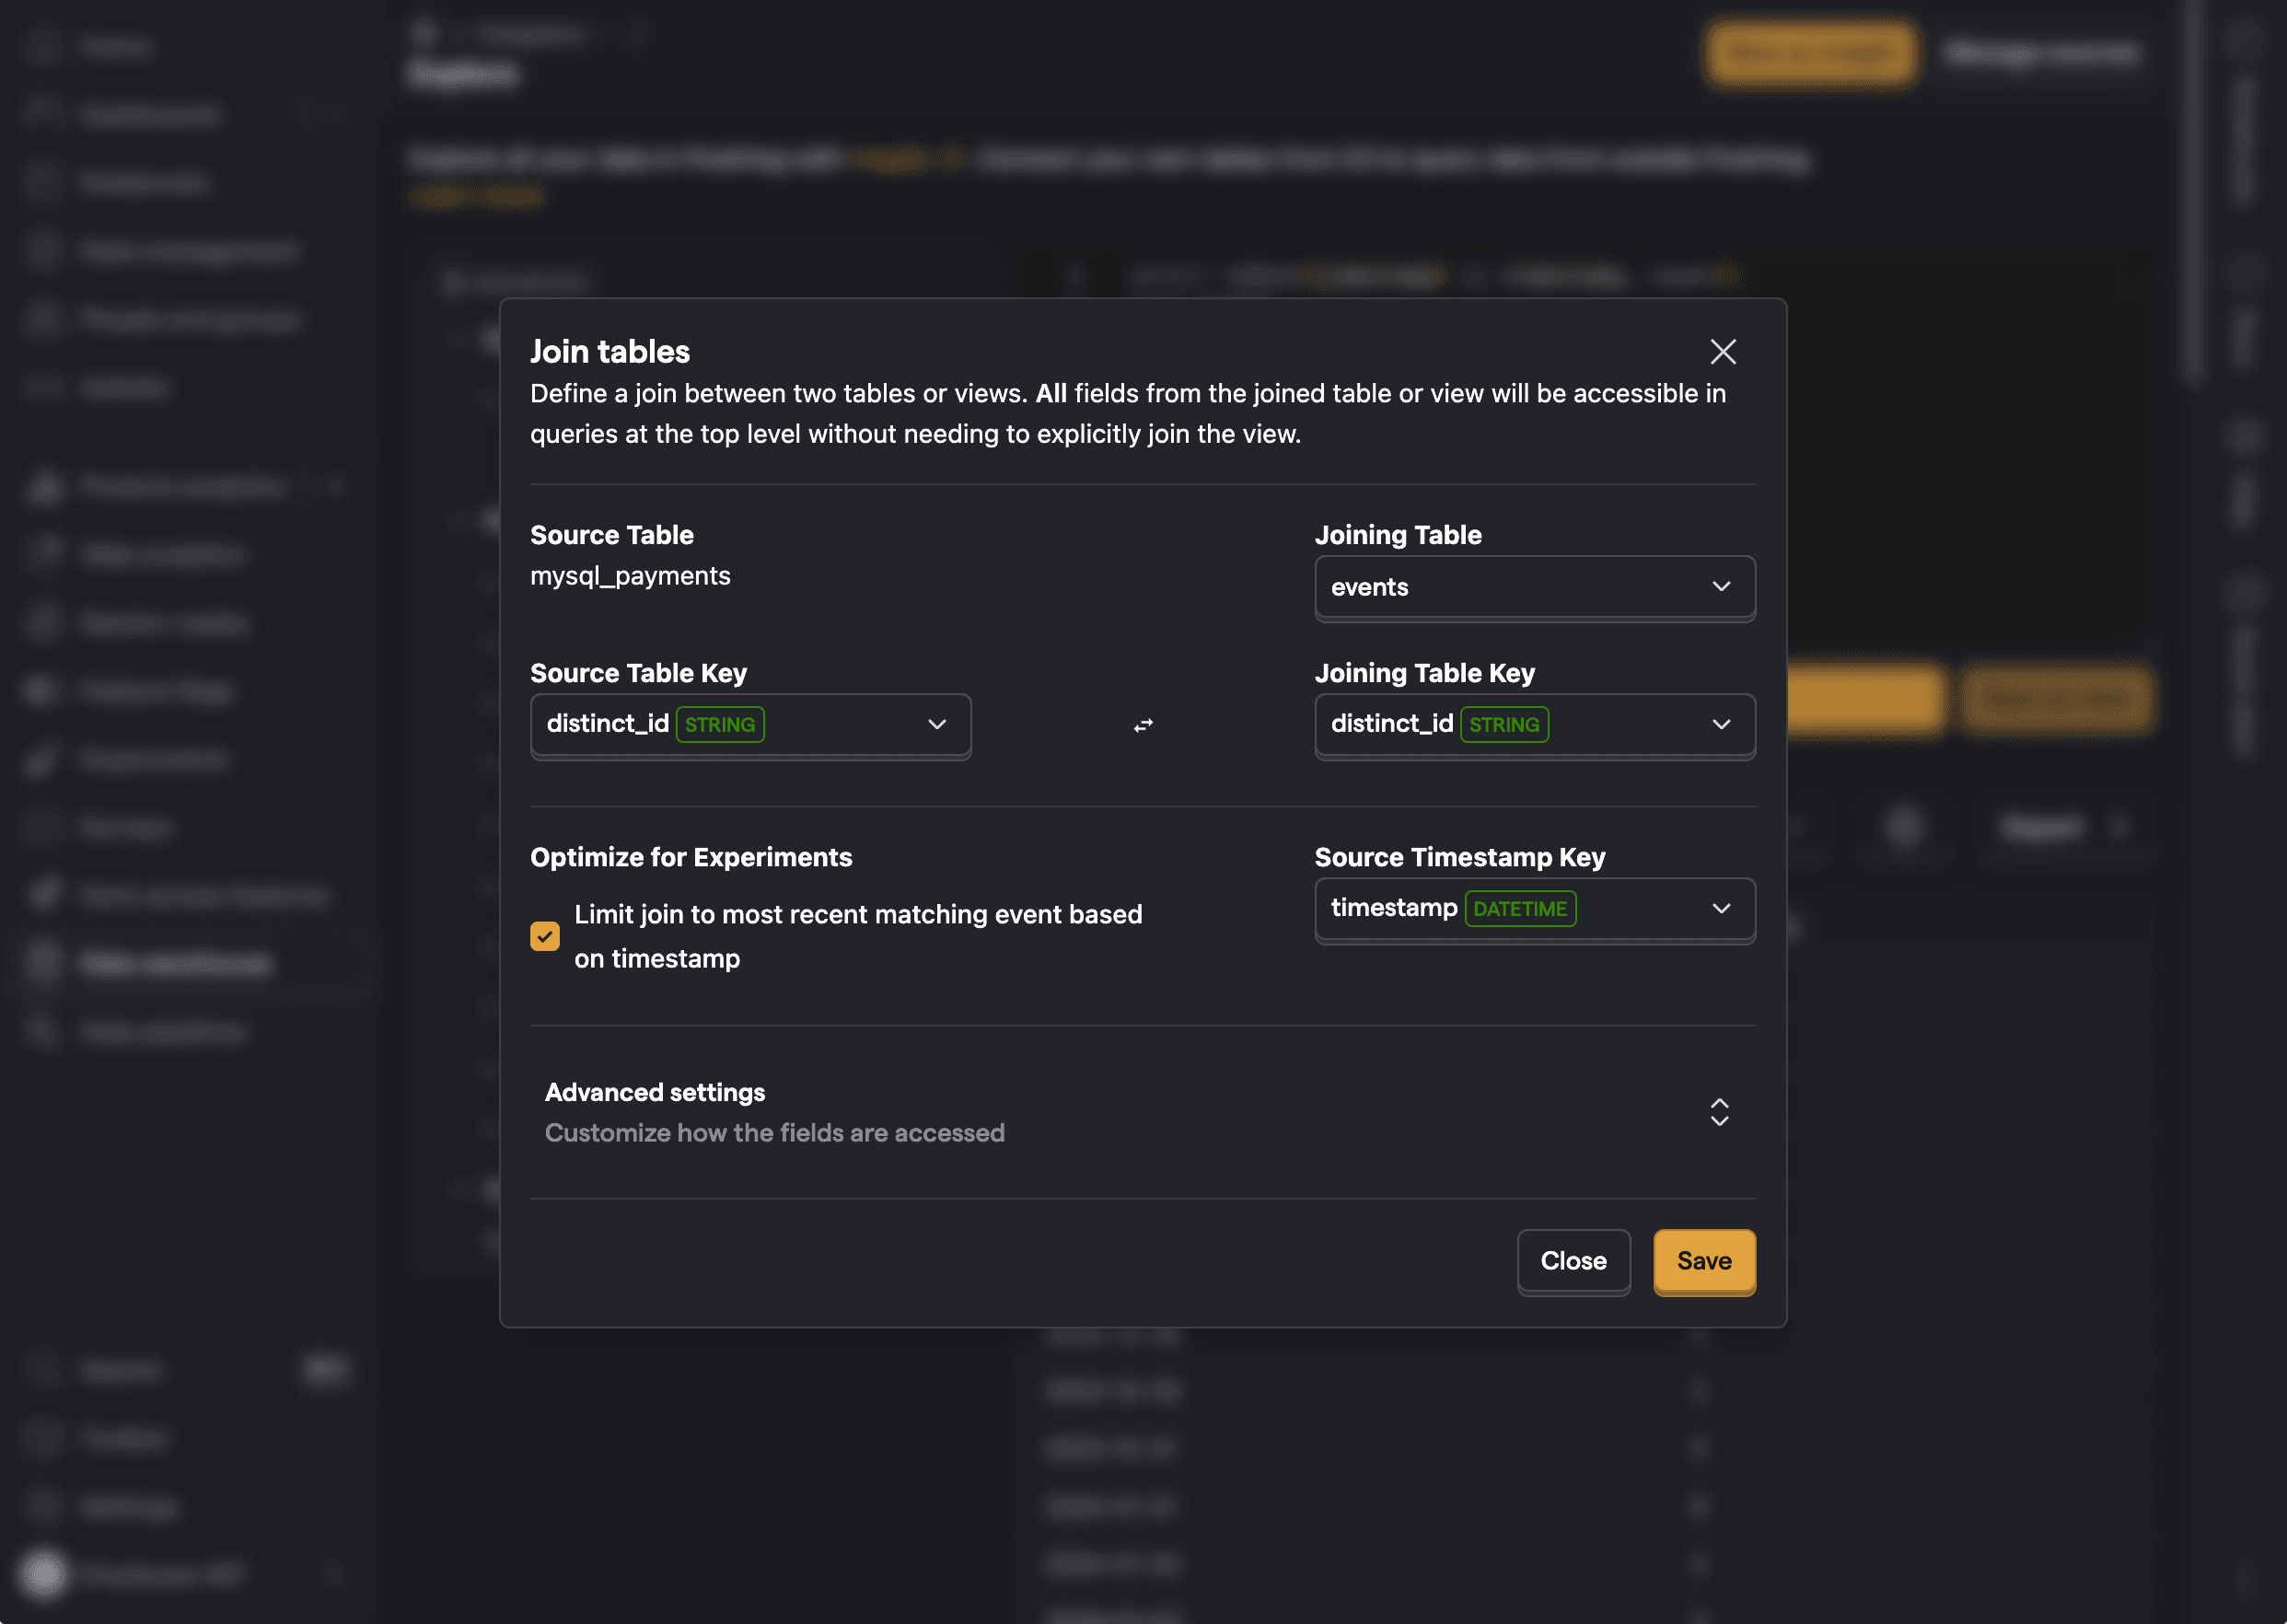
- Join the
eventstable to your data warehouse table: a. Under Source Table Key, specify a column that holds the value of thedistinct_idpresent for the$feature_flag_calledevent. b. Check Optimize for Experiments to ensure only the most recent matching event is joined to your table. c. Under Source Timestamp Key, specify a column that represents the timestamp of the table row. It will be compared with the event timestamp to determine the most recent$feature_flag_calledevent for the row.
Once you've joined the events table to your data warehouse table, you can use the data warehouse table in the experiment goal or as a secondary metric:
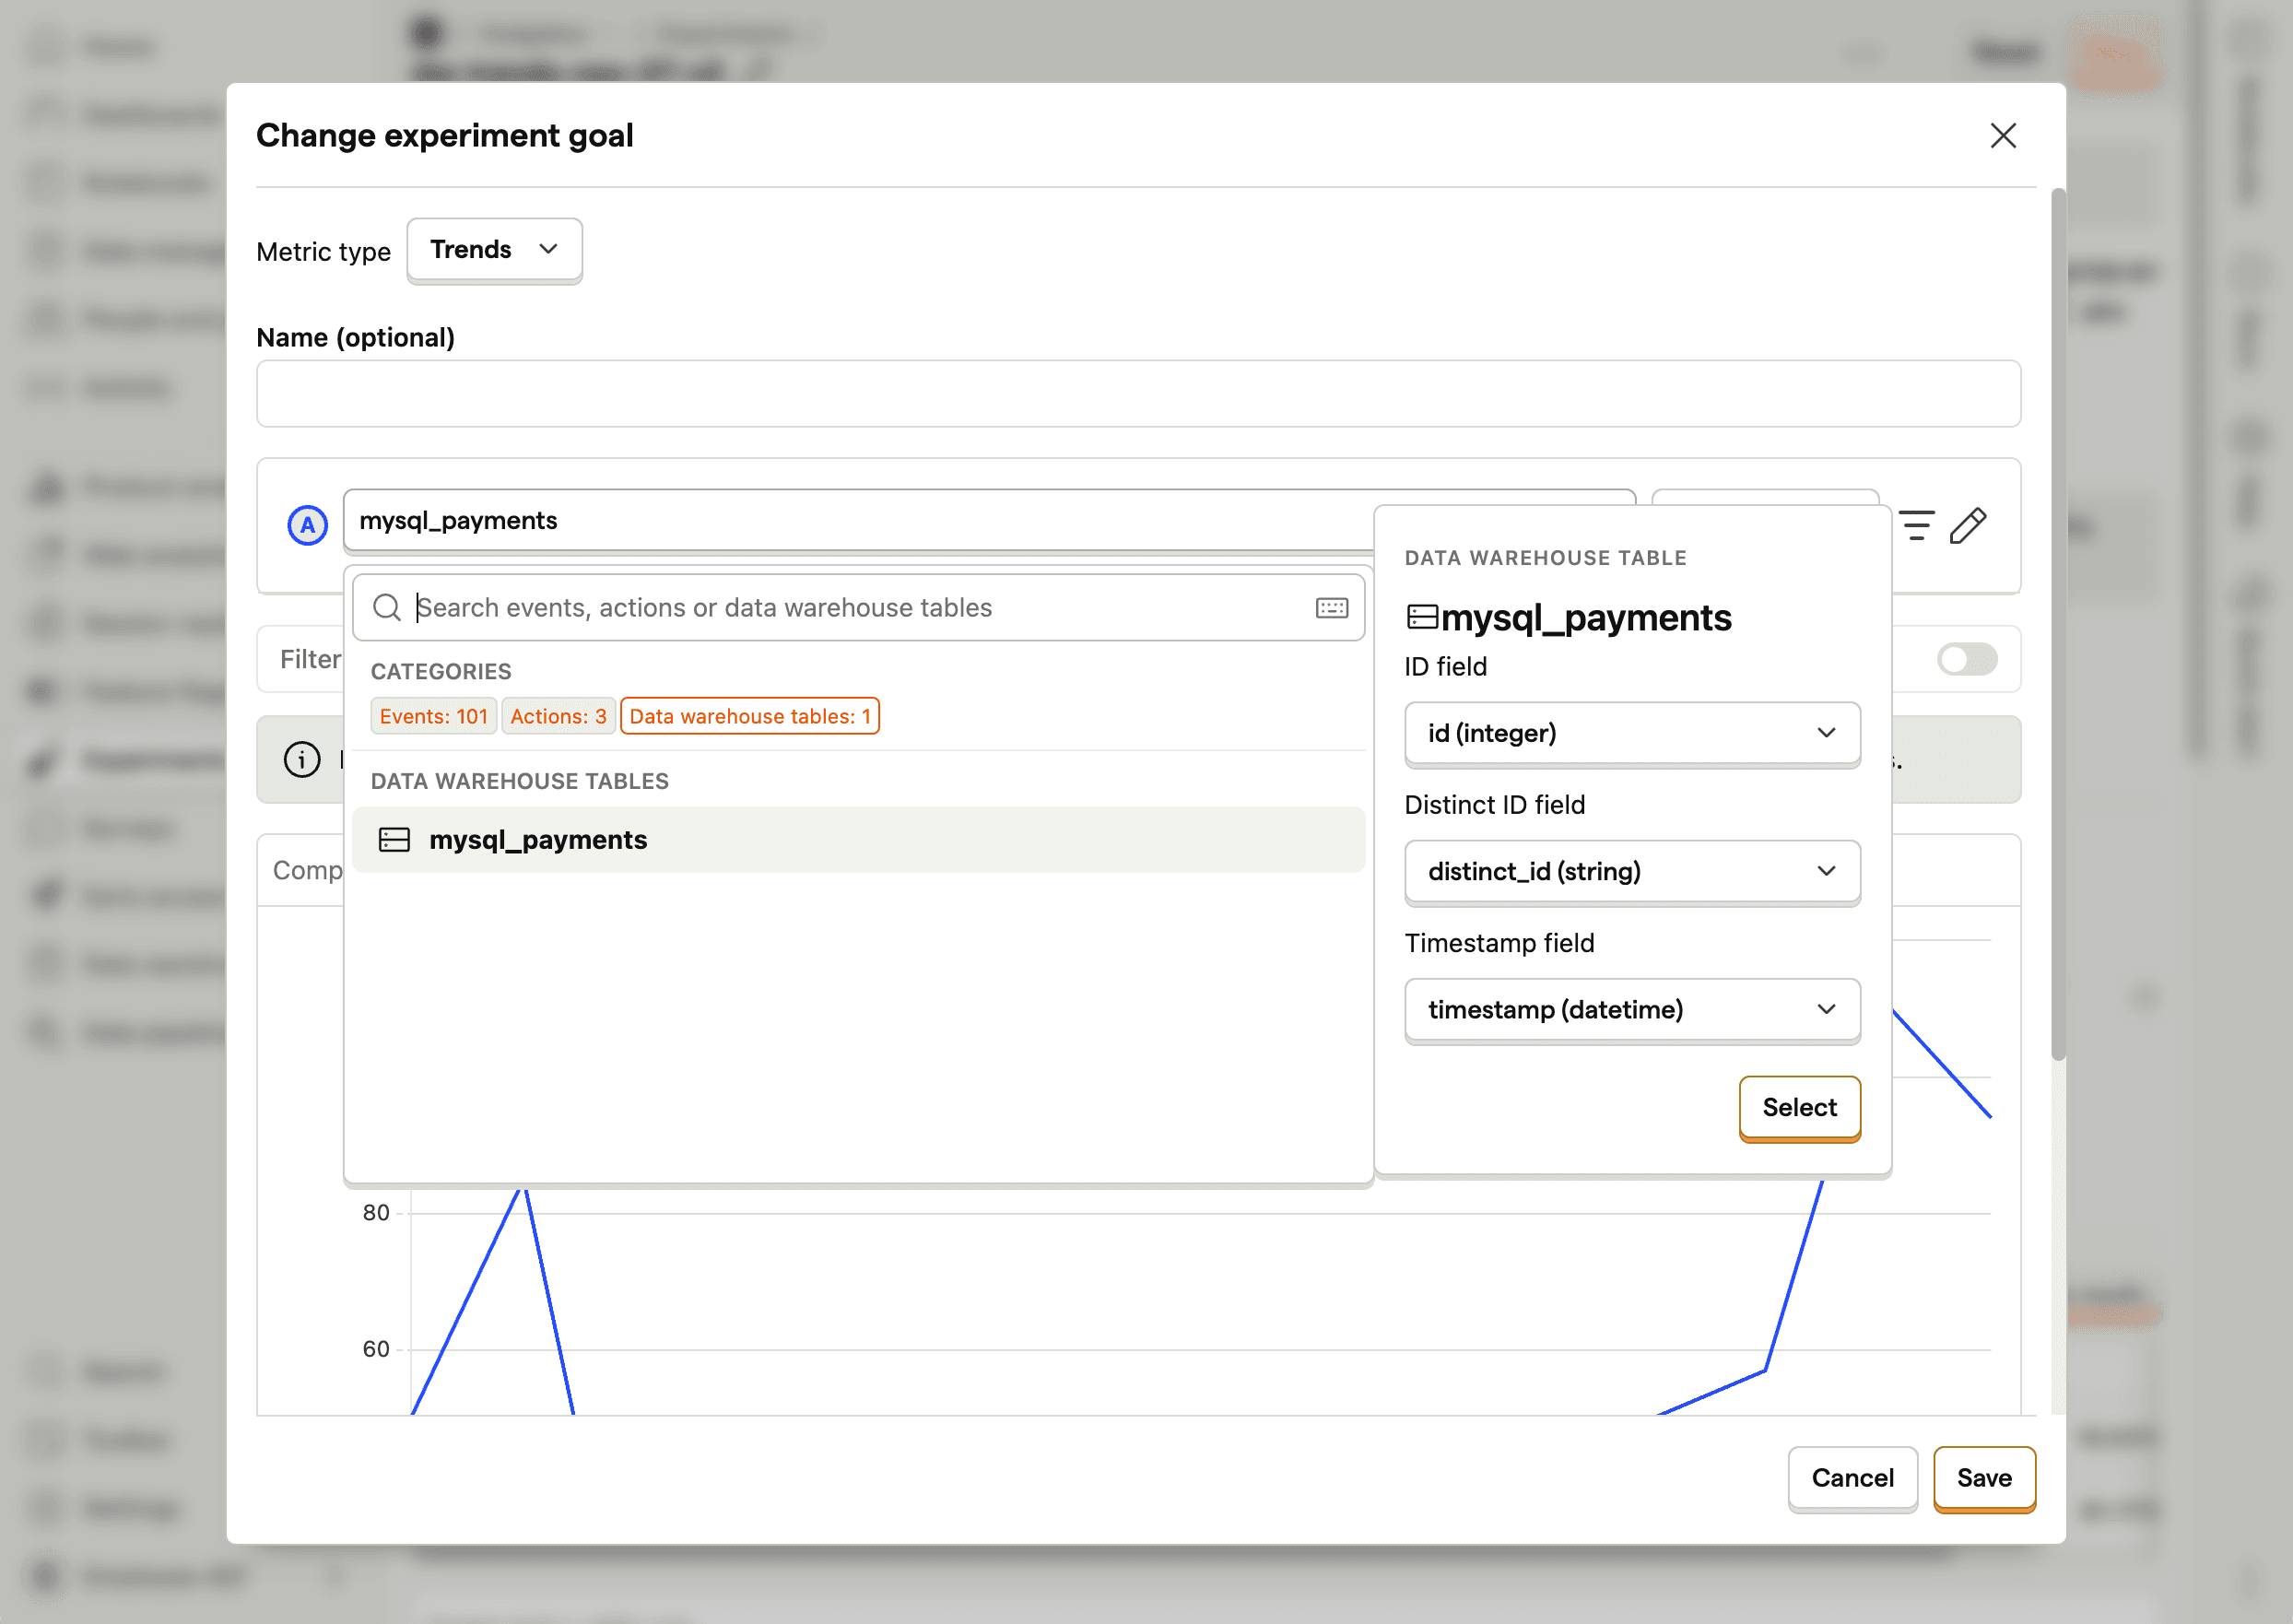
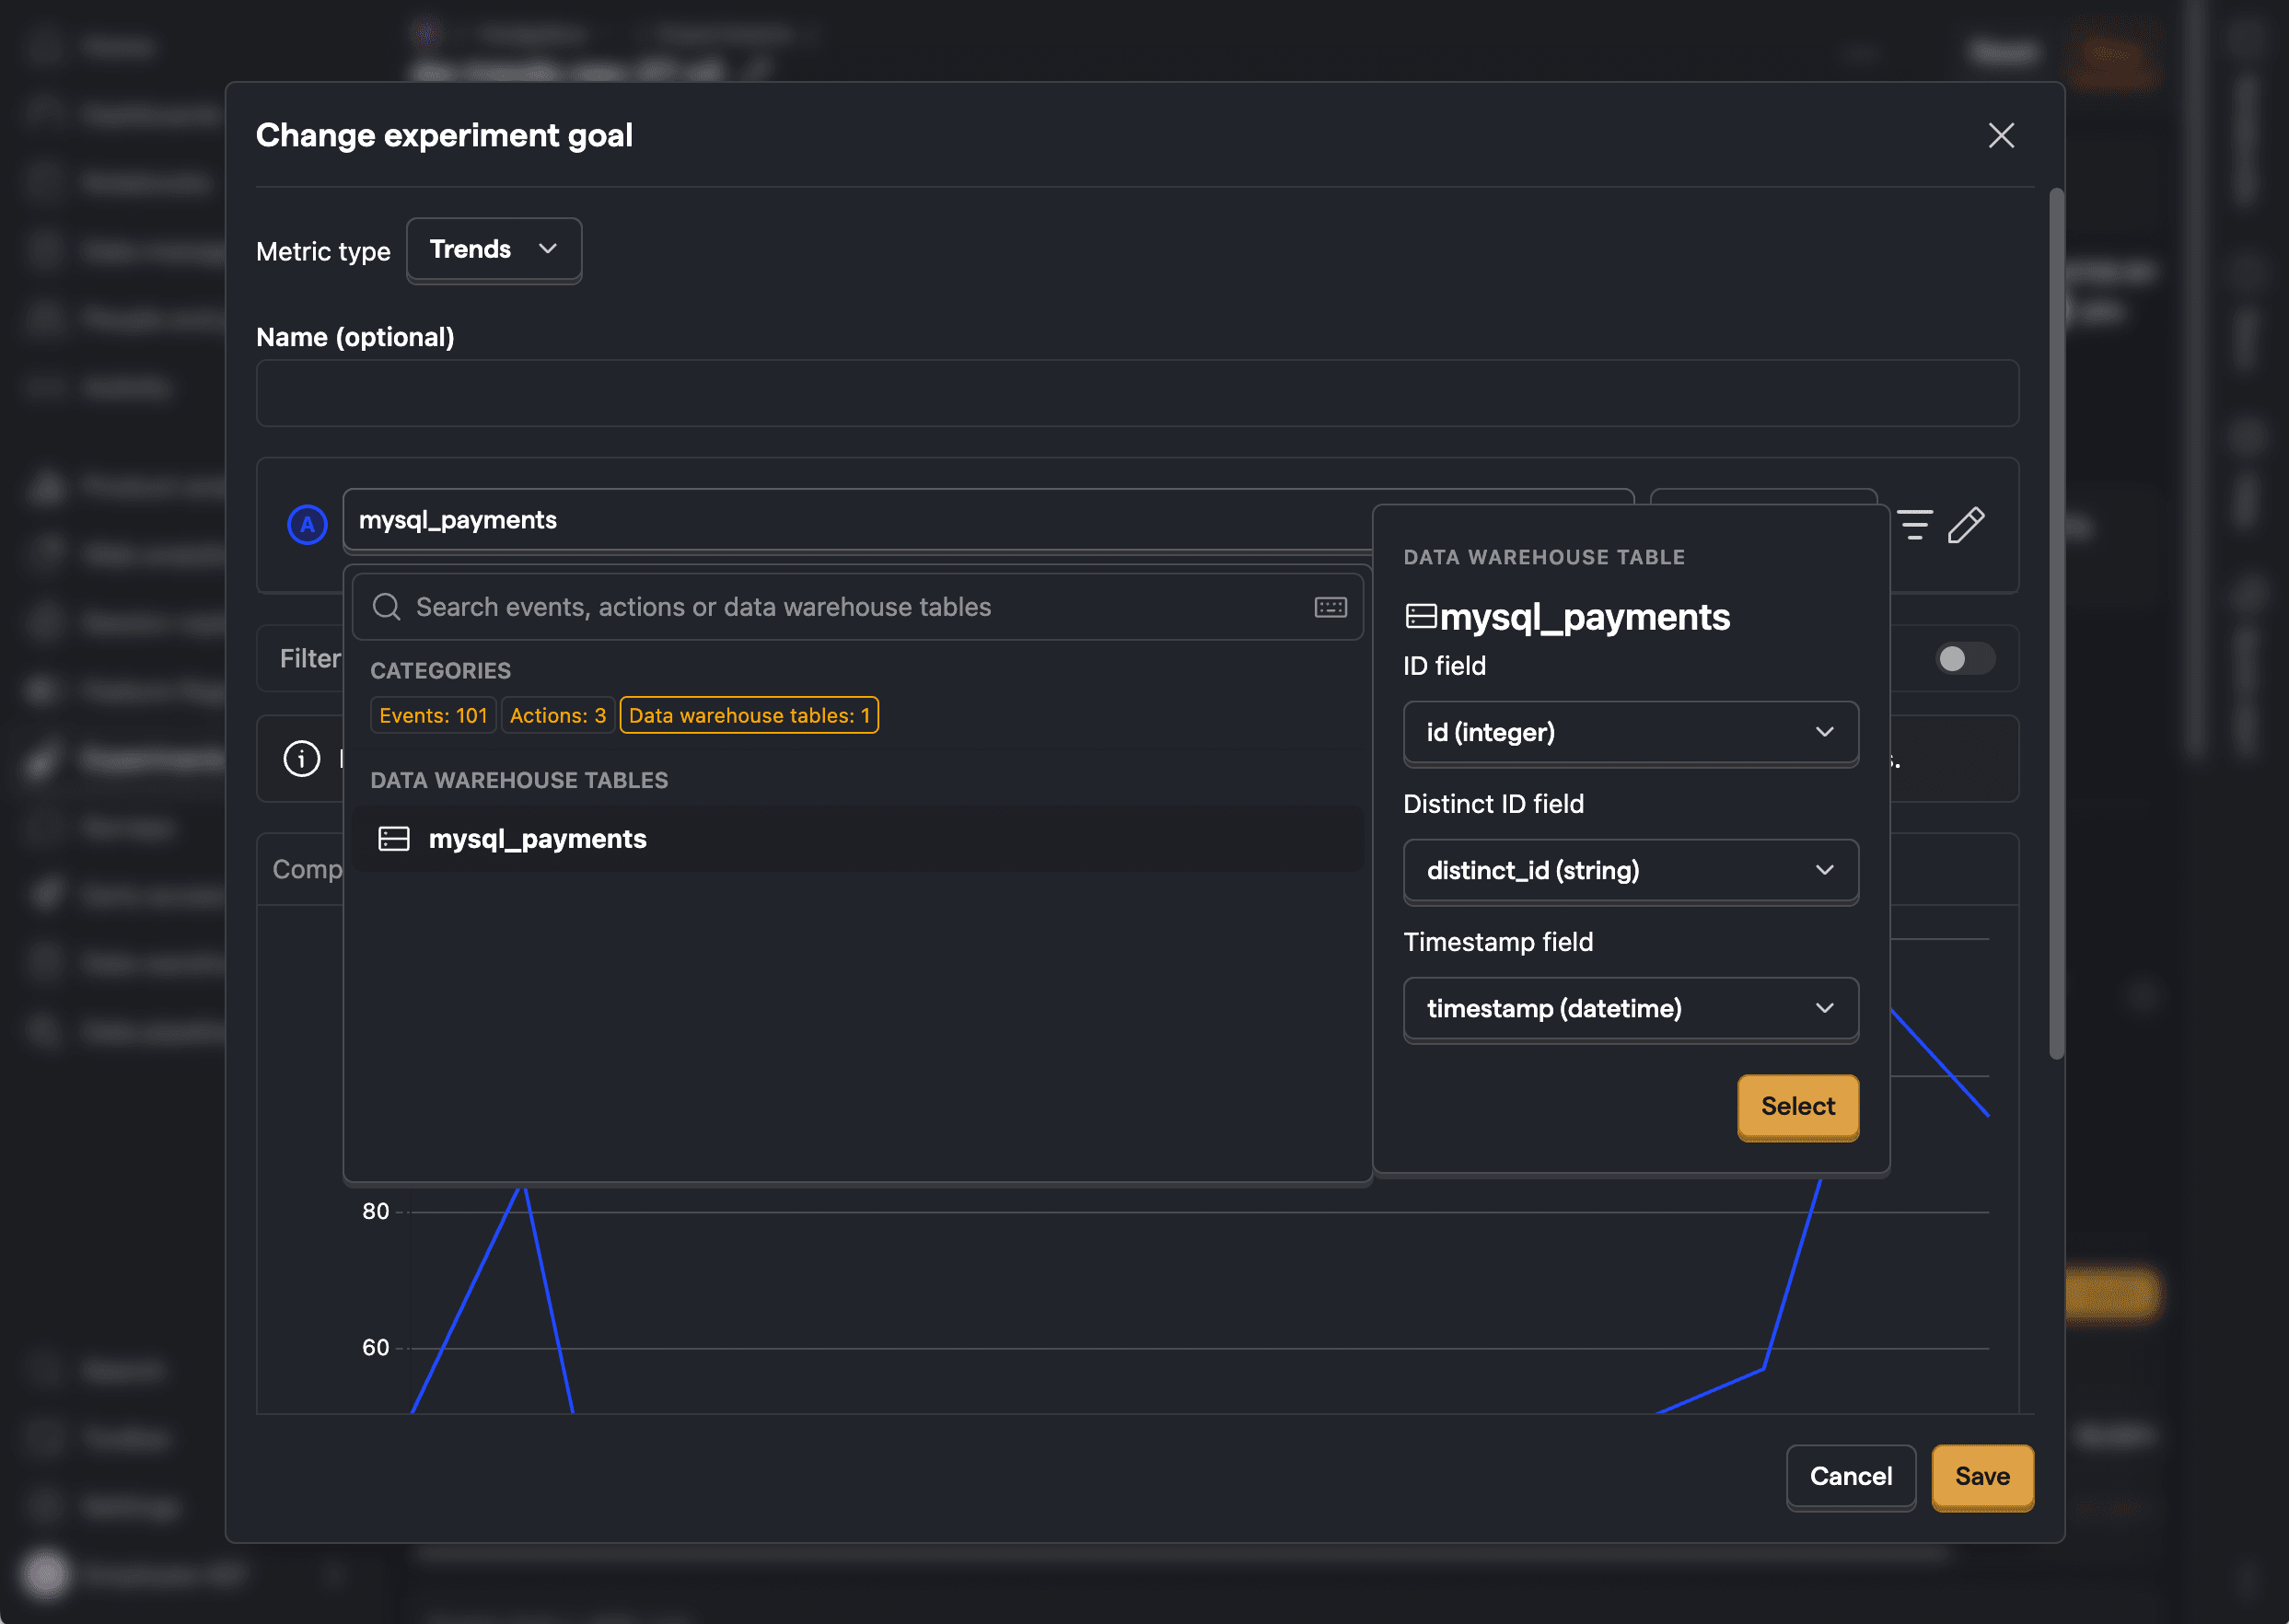
- When picking an experiment goal, click on the Data warehouse tables category and select your table.
- Specify the columns in your data warehouse table that represent the unique ID, the distinct ID, and the timestamp.
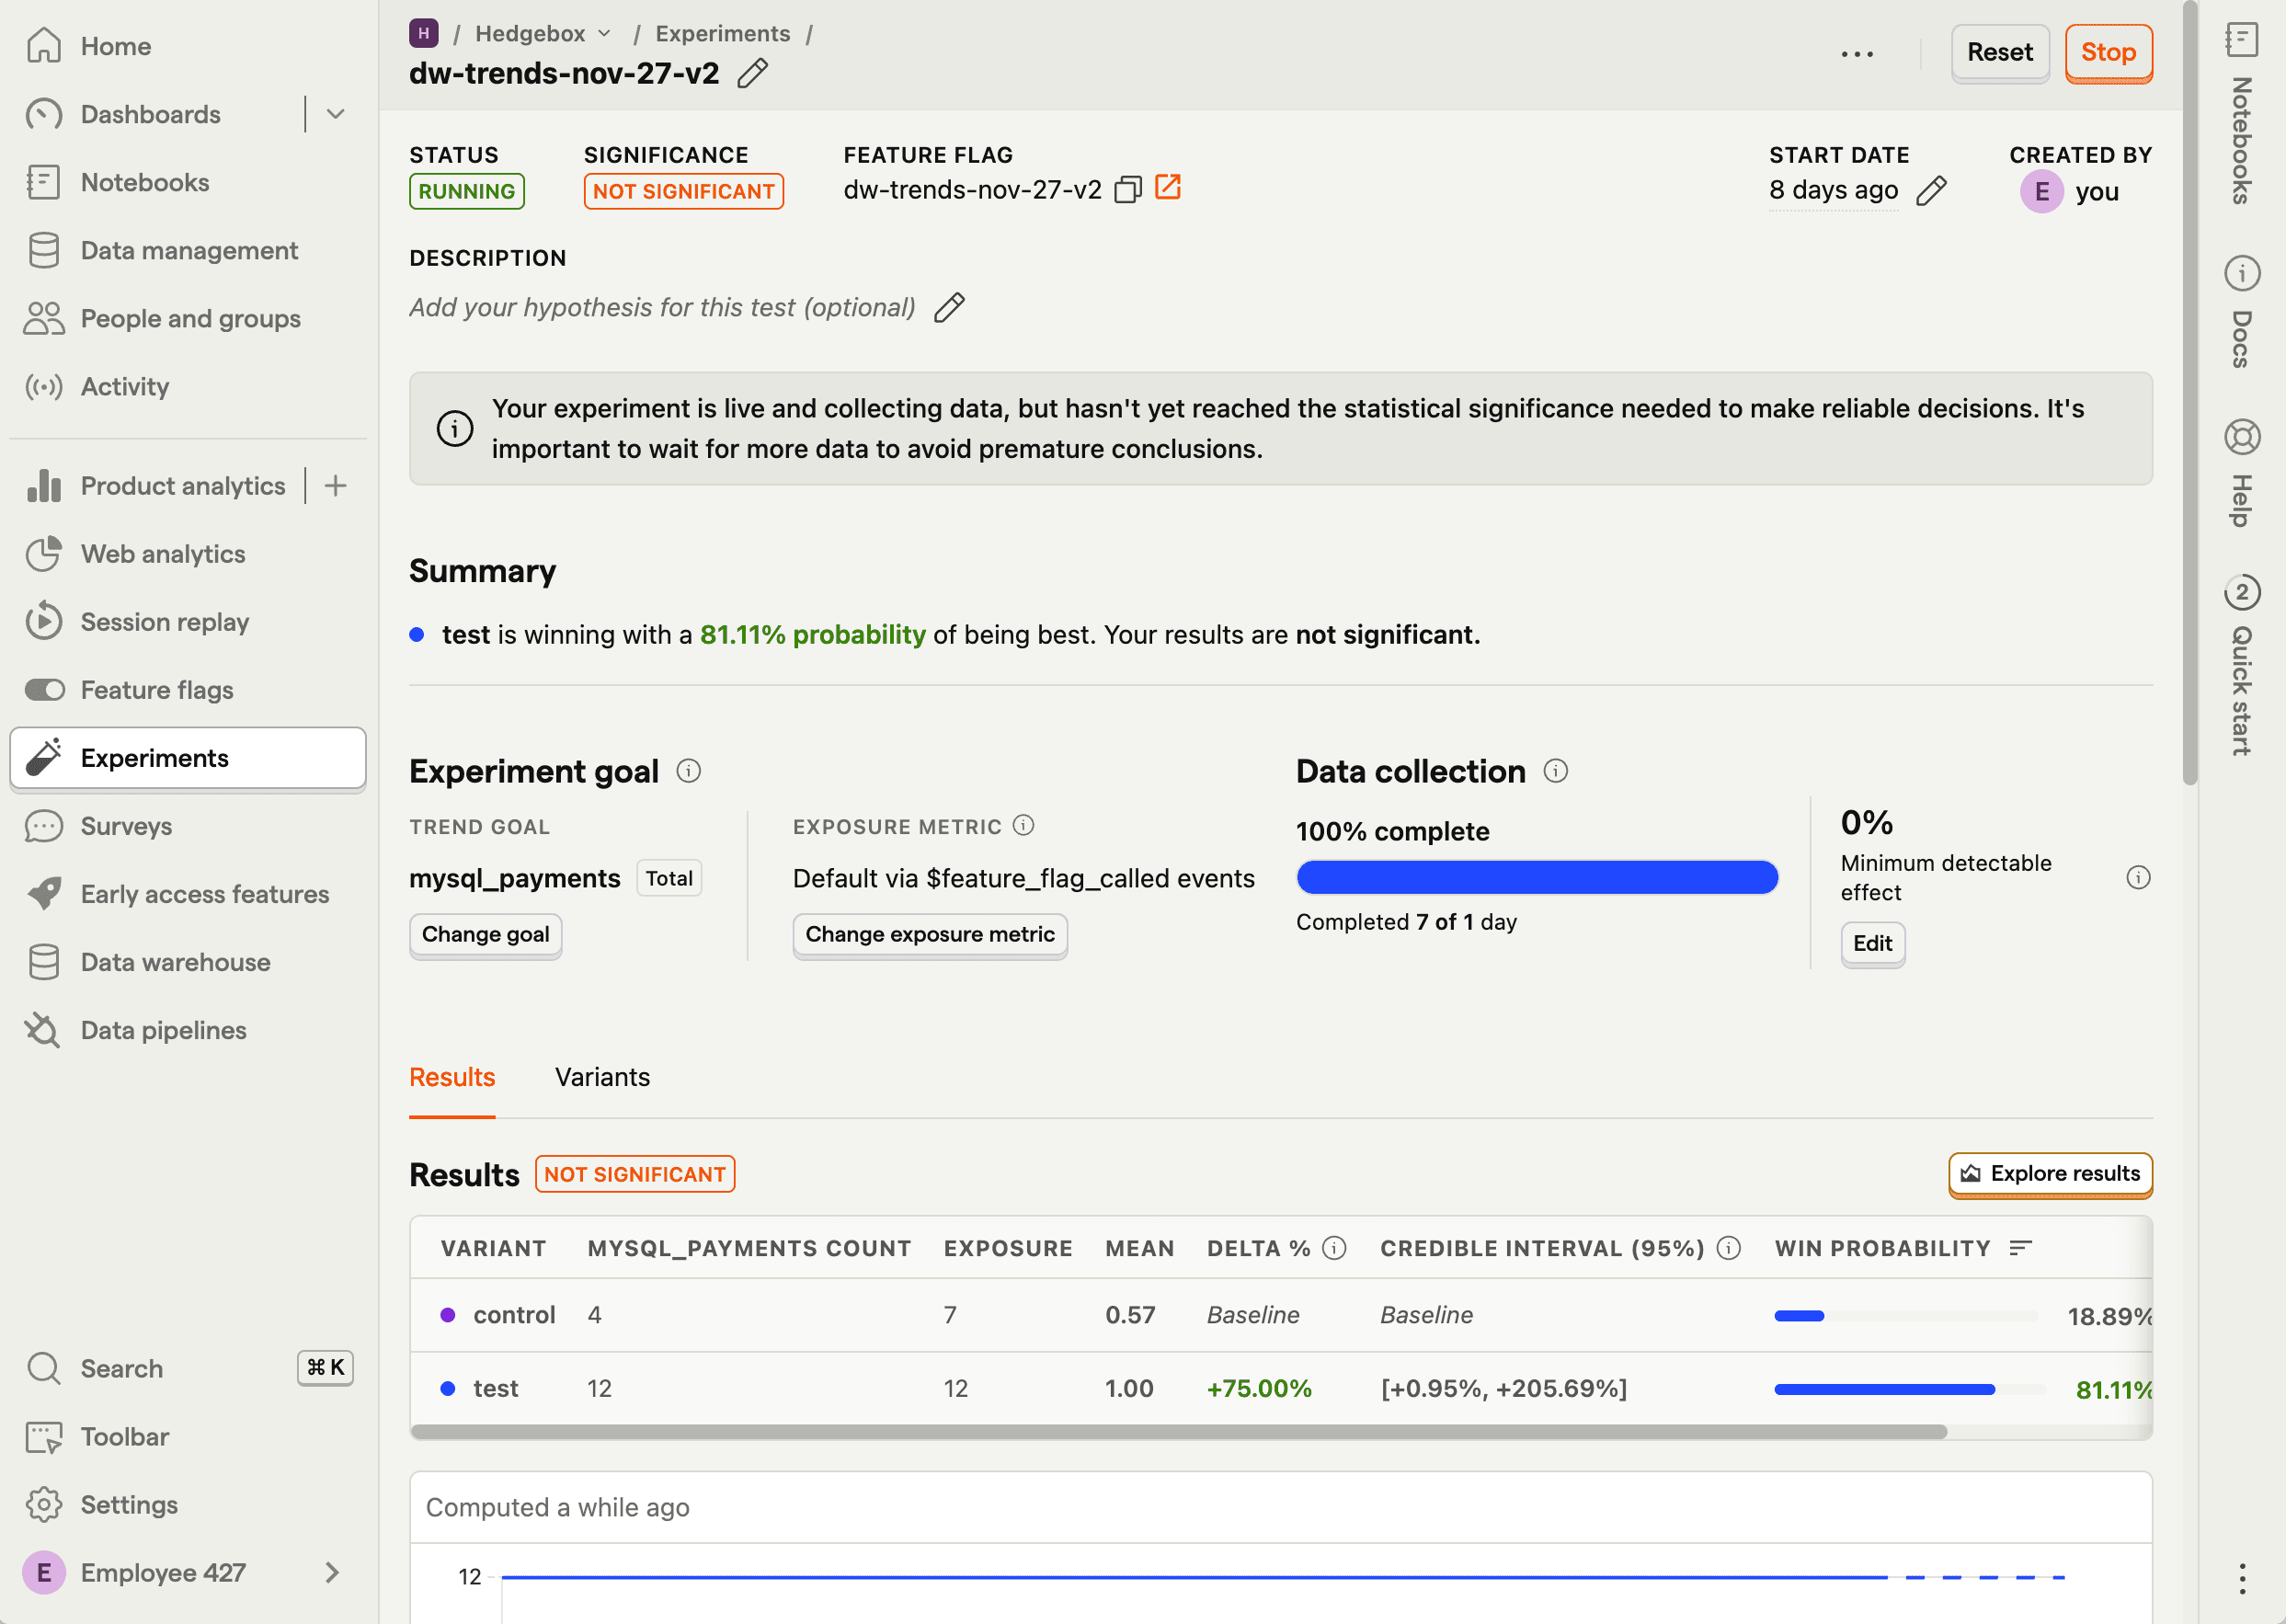
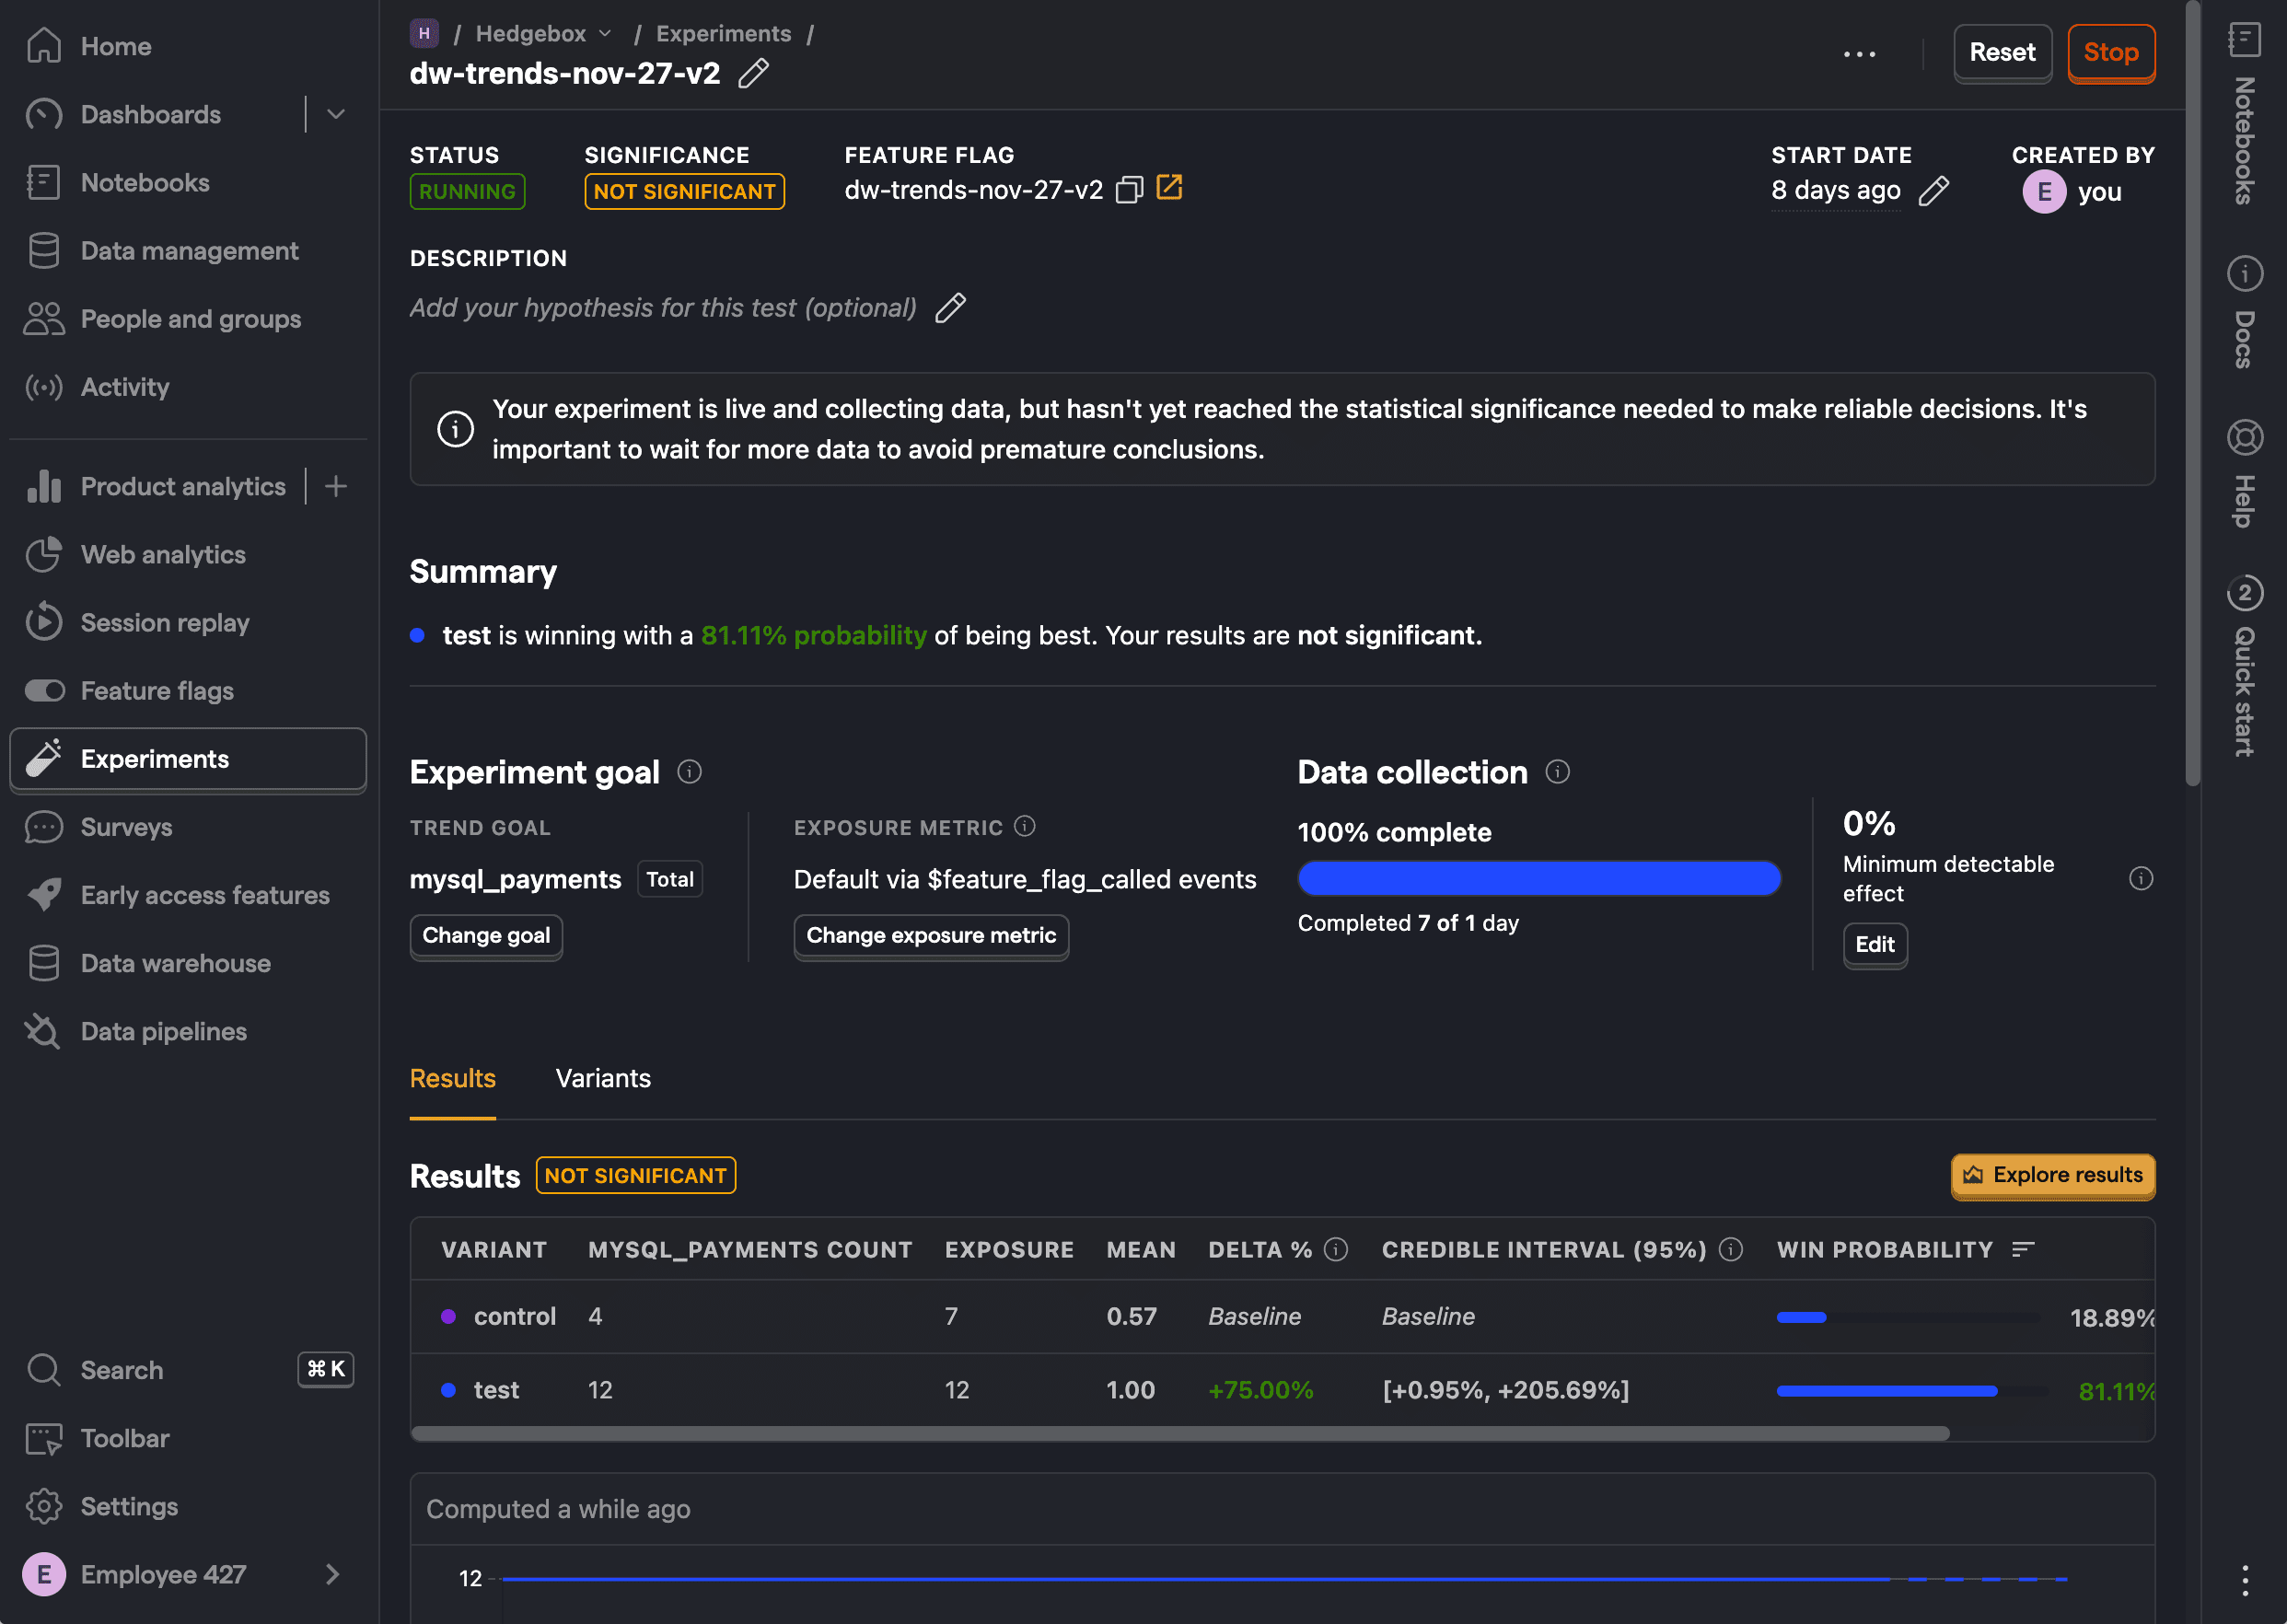
When you select a data warehouse table as an experiment goal or secondary metric, PostHog sees it as an 'events-like' table and is thus able to use it to calculate results.
The PostHog uses the join to the events table to determine which variant a given data warehouse table row is associated with. For trends experiments, the most recent $feature_flag_called event before the row represents their active variant assignment: